Effective communication between a SaaS product designer and stakeholders is vital for the success of any software project. By understanding stakeholder language, designers can recognize their unique perspectives, priorities, and concerns. This awareness enhances collaboration and significantly influences design decisions, leading to better outcomes.
This collaborative approach fosters trust and ensures the final product aligns with user needs and market demands.
Let’s explore this Stakeholder Language Glossary together with examples and calculators.
ROI (Return on Investment)
Return on Investment (ROI) is a crucial metric for evaluating the effectiveness of business expenditures. It measures whether the financial resources you allocate yield a worthwhile return.
Think of it as planting a seed: the cost of the seed represents your investment, while the plant’s growth symbolizes the returns you receive. By assessing ROI, you can determine how effectively your investments contribute to your business’s success.
ROI calculator:
Suppose you invest $1,000 in a marketing campaign that generates $5,000 in sales. To calculate the ROI, you would use the formula:
[ \text{ROI} = \frac{\text{Net Profit}}{\text{Cost of Investment}} \times 100 ]
In this case, your net profit is $5,000 (sales) – $1,000 (investment) = $4,000. Plugging the numbers into the formula gives you:
[ \text{ROI} = \frac{4,000}{1,000} \times 100 = 400% ]
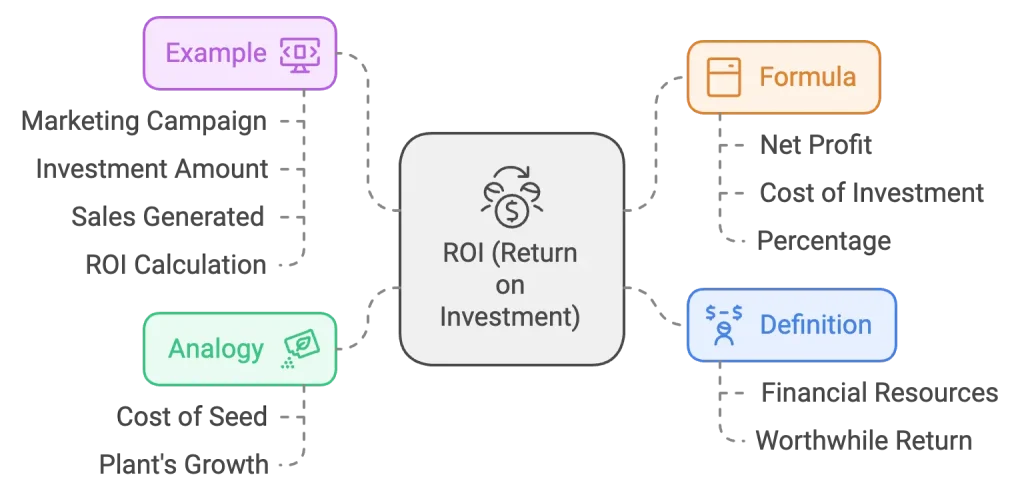
This means you earned four dollars in return for every dollar spent on the marketing campaign, indicating a highly successful investment.
KPI (Key Performance Indicator)
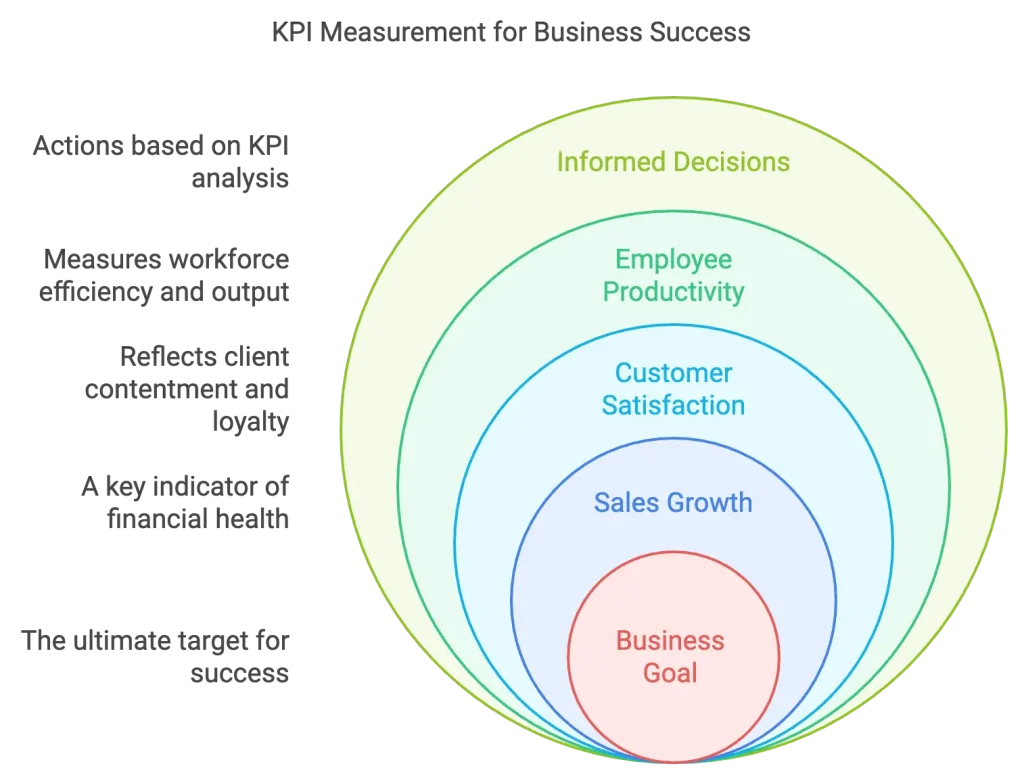
Key Performance Indicators (KPIs) are essential metrics that help you assess your business’s health and performance. They provide valuable insights into whether your company meets its goals and objectives.
KPIs are like grades on a report card, reflecting how well your business is performing in various areas.
KPI calculator:
Consider a retail business that tracks its sales growth as a KPI. If the company sets a target of a 10% increase in sales over the year and achieves a 15% increase, this positive result indicates strong performance. Conversely, if sales only grew by 5%, it would signal the need to improve sales strategies. By regularly monitoring KPIs like sales growth, customer satisfaction, and employee productivity, businesses can make informed decisions to drive success.
MVP (Minimum Viable Product)
A Minimum Viable Product (MVP) is the most basic version of your product that still delivers value to users. It allows you to test your core concept without the complexities of additional features.
Imagine you’re developing a new mobile app for fitness tracking. Instead of launching a fully-featured app with advanced analytics, social sharing, and personalized coaching, you start with an MVP that includes only the essential features: tracking workouts and logging meals.
By releasing this basic version to a select group of users, you can gather feedback on its usability and effectiveness. If users respond positively, you can then invest in adding more features based on their preferences, ensuring that your final product meets their needs.
CAC (Customer Acquisition Cost)
Customer Acquisition Cost (CAC) is the total money spent to acquire a new customer. This metric helps businesses understand the effectiveness of their marketing and sales efforts.
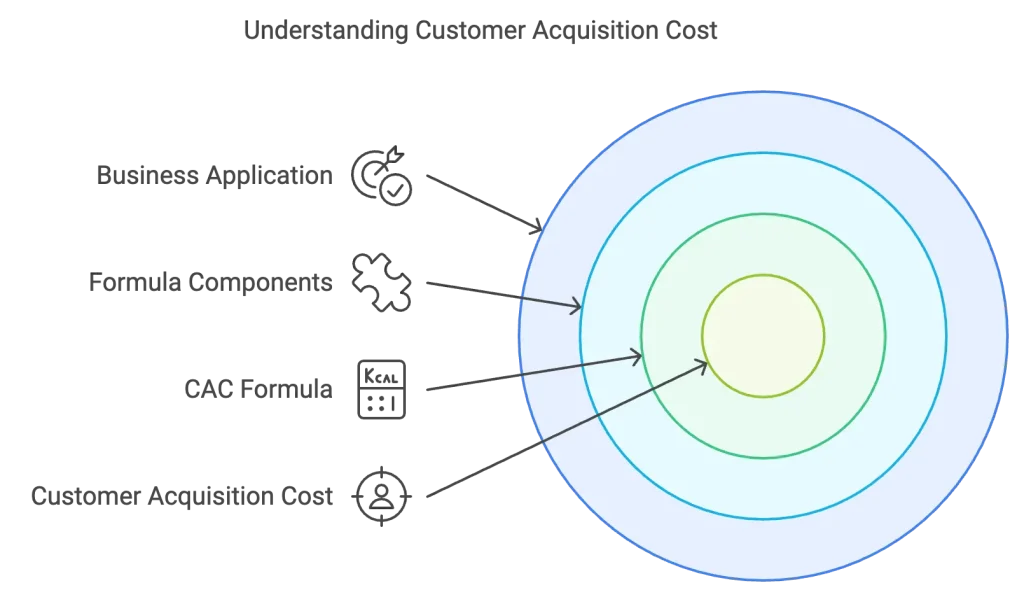
CAC calculator:
Suppose you spend $5,000 on a marketing campaign that attracts 100 new customers. To calculate your CAC, you would divide the total marketing expenses by the number of new customers acquired:
[ \text{CAC} = \frac{\text{Total Marketing Expenses}}{\text{Number of New Customers}} ]
In this case, it would be:
[ \text{CAC} = \frac{5,000}{100} = 50 ]
This means it costs you $50 to acquire each new customer. Understanding your CAC is crucial for evaluating the sustainability of your business model and ensuring that your customer acquisition strategies are cost-effective.
LTV (Lifetime Value)
Lifetime Value (LTV) estimates the total revenue a customer will generate for your business throughout their entire relationship with you. This metric helps companies to understand the long-term value of acquiring and retaining customers.
You can think of it as predicting how many haircuts a loyal customer might get at your barbershop over the years.
LTV calculator:
Imagine a barbershop where a regular customer visits for a haircut every month, and each haircut costs $30. If you estimate that this customer will continue to visit for 5 years, you can calculate their LTV as follows:
[ \text{LTV} = \text{Average Purchase Value} \times \text{Number of Purchases per Year} \times \text{Customer Lifespan} ]
In this case:
[ \text{LTV} = 30 \times 12 \times 5 = 1,800 ]
This means the estimated lifetime value of that loyal customer is $1,800. Understanding LTV helps businesses decide how much to invest in customer acquisition and retention strategies.
Conversion Rate
The conversion rate is a metric that indicates the percentage of people who take a desired action, such as making a purchase, after interacting with your product or service.
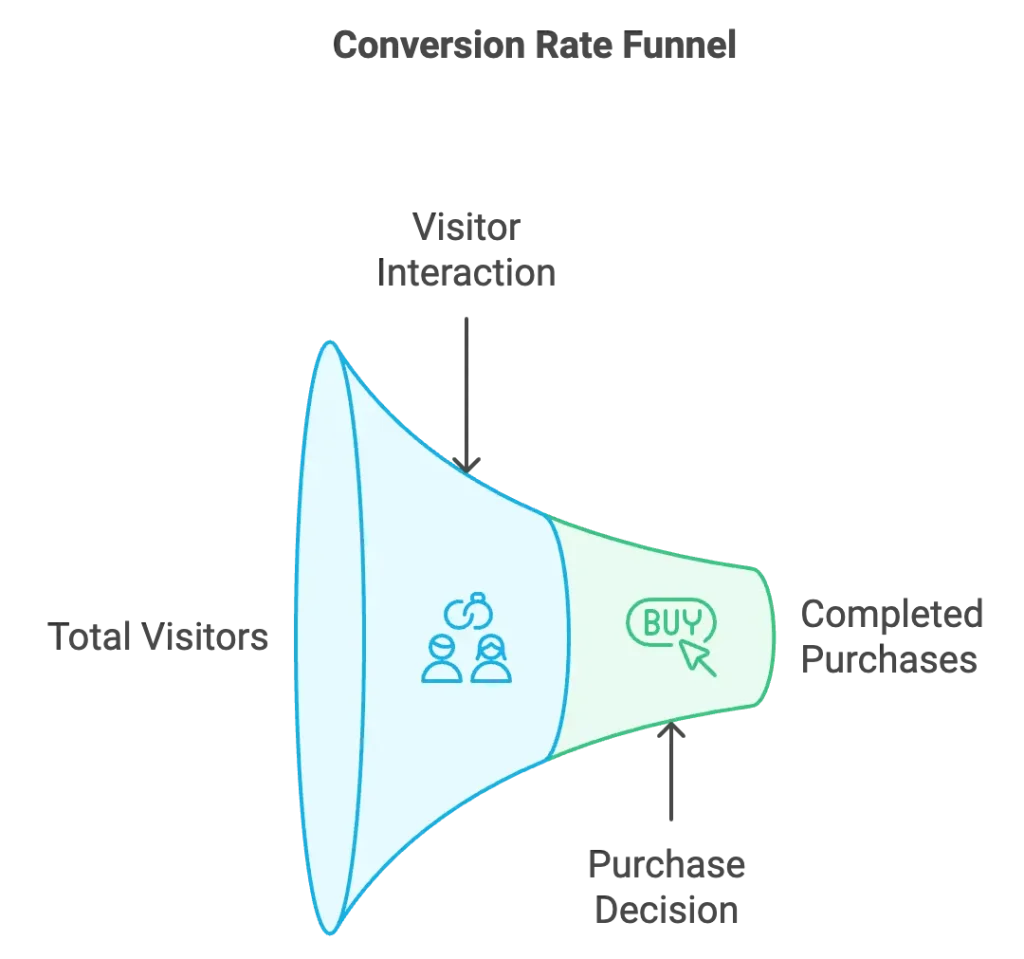
For instance, if 100 people visit your online store and 5 of them make a purchase, your conversion rate would be calculated as follows:
[ \text{Conversion Rate} = \left( \frac{\text{Number of Purchases}}{\text{Total Visitors}} \right) \times 100 ]
In this case:
[ \text{Conversion Rate} = \left( \frac{5}{100} \right) \times 100 = 5% ]
This means that 5% of the visitors to your online store bought something. Understanding your conversion rate is crucial for evaluating the effectiveness of your marketing strategies and optimizing your sales process.
Lacking a solid grasp of business principles can lead to significant risks, such as –
- Developing attractive but unfeasible solutions
- Failing to align your efforts with the company’s objectives
- Overlooking important market opportunities
- Having difficulty communicating effectively with stakeholders
Churn Rate
The churn rate is the percentage of customers who discontinue using your product or service over a specific period.
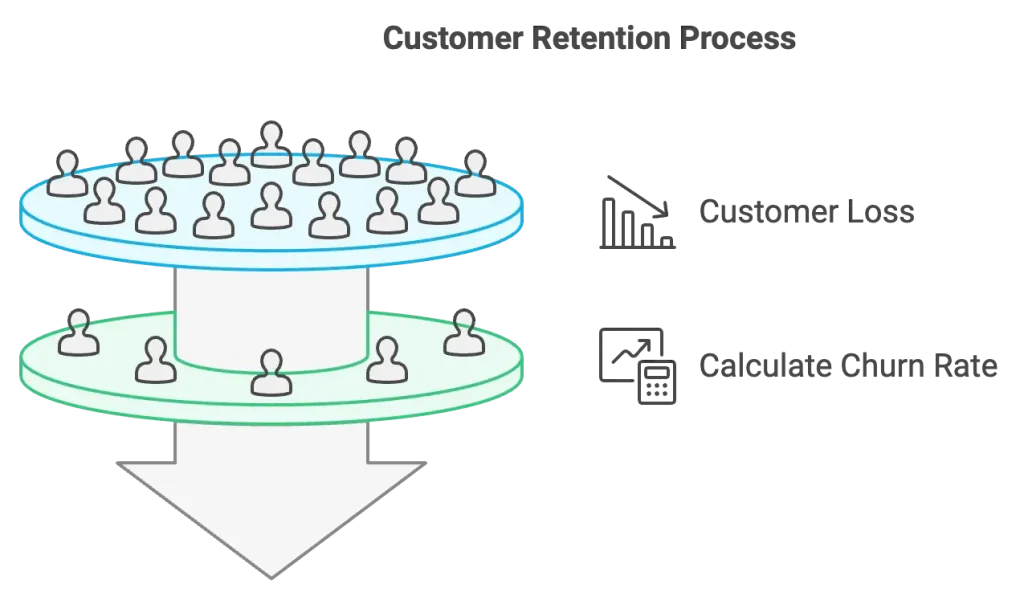
For example, if you have 200 customers at the beginning of the month and 20 of them stop using your service by the end of the month, your churn rate would be calculated as follows:
[ \text{Churn Rate} = \left( \frac{\text{Number of Customers Lost}}{\text{Total Customers at Start}} \right) \times 100 ]
In this case:
[ \text{Churn Rate} = \left( \frac{20}{200} \right) \times 100 = 10% ]
This means that 10% of your customers stopped using your product that month. Understanding your churn rate is essential for identifying retention issues and improving customer satisfaction.
Scalability
Scalability refers to your business’s ability to grow and manage increased demand without compromising performance or efficiency.
For instance, consider a lemonade stand that can easily make ten glasses of lemonade. If you suddenly need to produce 1,000 glasses for a significant event, you must assess whether your current recipe, equipment, and processes can handle that scale. Your business is scalable if your recipe and setup can be adjusted to meet the higher demand without losing quality.
Market Segmentation
Market segmentation involves dividing your potential customers into groups based on shared characteristics.
Think of it like sorting your Halloween candy into categories: one pile for chocolate treats, another for fruity flavors, and a third for sour goodies.
Value Proposition
The value proposition is the primary reason a customer should buy your product.
Think of it as the memorable tagline that makes your pizza shop stand out: “The cheesiest, most delicious slices in the neighborhood!”
Agile
Agile is a method of working that involves making progress incrementally and adapting plans swiftly as necessary.
It’s like cooking a new recipe, tasting as you go, and adjusting the ingredients based on your needs.
Lean
Lean focuses on maximizing efficiency by minimizing waste of time and resources.
It’s like organizing your workspace so everything you need is within reach, eliminating unnecessary clutter.
SWOT Analysis
SWOT Analysis is a method for evaluating your business idea’s positive and negative aspects. SWOT stands for Strengths, Weaknesses, Opportunities, and Threats.
It’s like creating a roadmap for a journey, identifying the best routes, potential roadblocks, and scenic detours along the way.
AARRR (Pirate Metrics)
AARRR is a catchy framework that outlines five key stages in expanding your business: attracting customers, engaging them with your product, ensuring their satisfaction, encouraging referrals, and generating revenue. It’s called “Pirate Metrics” because the pronunciation of the letters resembles a pirate’s exclamation: “Aarrr!”
It’s like navigating a treasure map, where each step leads you closer to the ultimate prize of success.
Cultivating business acumen can elevate you from a “task executor” to a valuable strategic ally.
Hello, I’m Prince Pal — a freelance UI/UX designer specializing in SaaS web & mobile apps.
With 12+ years of experience, I help B2B SaaS companies create intuitive and beautiful product designs that keep users returning.
OKR (Objectives and Key Results)
OKR is a method for establishing goals and tracking your progress toward achieving them.
It’s similar to declaring, “I want to run a marathon this year,” and then tracking the miles you run each week.
TAM (Total Addressable Market)
TAM is the process of determining the total number of potential customers for your product.
It’s like assessing how many people in your neighborhood might be interested in joining a community gardening club if you decide to start one.
NPS (Net Promoter Score)
NPS gauges how likely your customers are to recommend your product to others.
It’s like asking your colleagues, “On a scale of 1 to 10, how likely are you to suggest this new coffee shop to your friends?”
Kanban
Kanban is a method for organizing tasks using visual cards on a board.
It’s like using a bulletin board with sections for “Ideas,” “In Progress,” and “Completed” to manage your projects.
Freemium
Freemium is a model where you provide a basic version of your product for free while charging for premium features.
It’s like offering a free trial of a fitness app but requiring a subscription for access to advanced workout plans and personalized coaching.
Burndown Chart
A burndown chart is a visual representation that tracks the amount of work remaining over time.
It’s like monitoring the progress of a puzzle as you gradually place pieces, watching the space decrease as you complete it.
Feature Creep
Feature creep occurs when you continuously add new features to your product, making it more complex than necessary.
It’s like adding so many ingredients to a smoothie that you can no longer taste the fruit.
Touchpoint
A touchpoint is any instance where a customer engages with your business through an advertisement, a website visit, or a conversation with customer support.
It’s like tracking how you connect with a family member weekly—through phone calls, texts, or video chats.
Want to Improve the ROI of your SaaS product?
By grasping key concepts such as ROI, market positioning, and user acquisition costs, you can –
🍪
Create designs that not only captivate users but also fuel business growth.
📢
Communicate effectively with executives and stakeholders, enhancing your impact.
🎯
Make informed, data-driven decisions that align user needs with business goals.
🌱
Discover new avenues for innovation and market expansion for your SaaS business.
Ready to elevate your design strategy? Start applying these principles today and watch your influence and success grow!
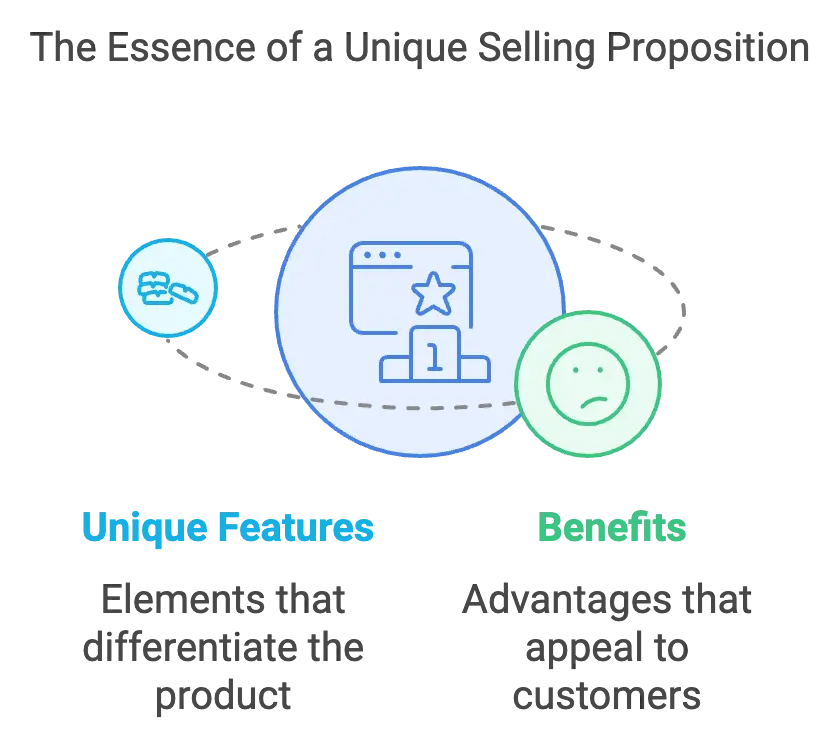
USP (Unique Selling Proposition)
A USP sets your product apart, highlighting its unique features or benefits.
It’s like having a secret recipe that makes your dish taste better than any other restaurant’s.
Customer Retention
Customer retention focuses on ensuring that your customers choose your brand over others.
It’s like creating a cozy coffee shop atmosphere that makes patrons want to return for their daily cup of coffee.
Engagement
Engagement measures the level of interaction users have with your product.
It’s like tracking how often someone reads and shares their favorite book with friends.
Growth Hacking
Growth hacking involves discovering innovative, often budget-friendly, strategies to increase your customer base rapidly.
It’s like discovering a unique way to promote your homemade cookies, which will soon make them the talk of the neighborhood.
Viral Coefficient
This measures how effectively your existing users bring in new users.
It’s like seeing how many new players join a game because their friends are already playing it.
Cohort Analysis
This involves examining groups of users who share a specific trait over time.
It’s like observing how different types of athletes perform in various weather conditions during a season.
Conversion Funnel
This represents users’ journey toward becoming customers, narrowing at each stage.
It’s like a staircase where each step gets more petite, with some people choosing to step off before reaching the top.
Product-Market Fit
This occurs when your product aligns perfectly with the needs and desires of the market.
It’s like finding the ideal puzzle piece that completes the picture perfectly.
Value Stream Mapping
This method visualizes all the steps involved in delivering a product or service.
It’s like creating a flowchart of every cake-baking step, from mixing the ingredients to serving the first slice.
Time to Value
This measures how quickly a customer starts experiencing the benefits of your product after they begin using it.
It’s like how soon someone feels cozy after wrapping themselves in a warm blanket on a chilly evening.
Time to Market
This refers to the duration it takes to transform an idea into a product that customers can purchase.
It’s like the time it takes from when you first think, “I should open a flower shop,” to when you sell your first bouquet.
Runway
This indicates how long a startup can continue operating before it exhausts its financial resources.
It’s like knowing how many movie nights you can enjoy with your friends based on the snacks and drinks you have left.

Are you tired of losing customers due to clunky, outdated designs?
Let’s partner up to discuss how to uplevel your product’s design. I only take on a few clients – reach out today before the spots fill up.